Rayleigh-Taylor
instabilities (with animations)
(H. Schmeling, Institute of Geophysics, Goethe Univsity Frankfurt)
If a dense viscous layer rests on top of a less dense viscous layer,
the lower layer will become unstable and form a Rayleigh Taylor instability.
It will rise through the overburden in the form of diapirs. Geological examples
are salt domes or magmatic diapirs.
This instability is named after the famous physicists Lord Rayleigh
and Geoffrey Taylor
As example the figure shows a laboratory experiment by Hemin Koyi (1989,
Dissertation, Uppsala) in which a light layer (PDMS,black) was overlain
by a denser layer (bouncing putty). The faulted basement (plastillina) was
comparably stiff. After centrifuging the buoyant layer becomes unstable and
forms a series of diapirs.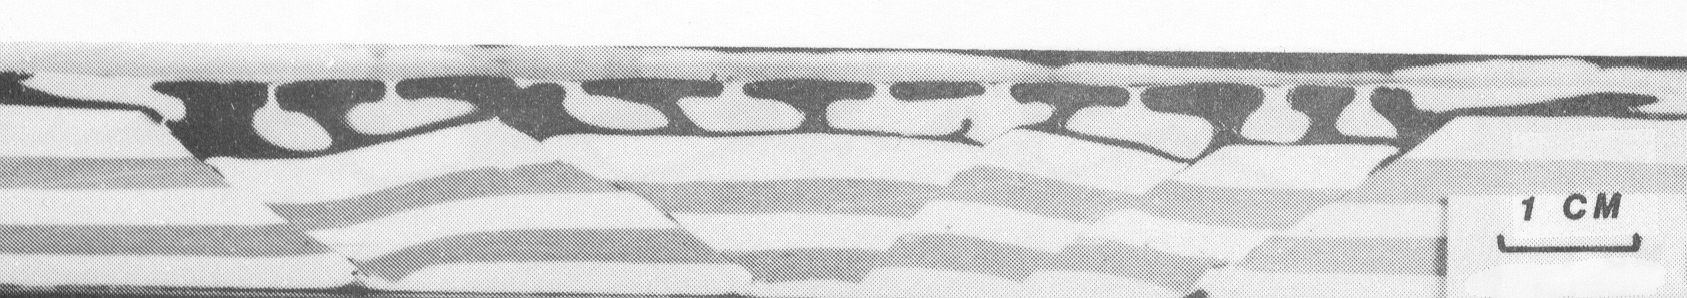
The following animations of numerical experiments demonstrate the evolution
of a Rayleigh-Taylor instability, and show how different viscosities and
boundary conditions influence the style of the instability and the
growth rates.
Case 1: Same viscosities
Free slip
Total model time: 4000 (s)
Char wavelength = 0.72 (m)
To play the movie, click here (mpeg,
7 Mbyte)
No slip
Total model time: 8000 (s)
Char wavelength = 0.36 (m)
To play the movie, click here (mpeg,
3.3 Mbyte)
Case 2: Weak
(0.01 Pa s) layer
Free slip
Total model time: 140 (s)
Char wavelength = 1.92 (m)
To play the movie, click here (mpeg, 4.9 Mbyte)
No slip
Total model time: 250 (s)
Char wavelength = 1.25 (m)
To play the movie, click here (mpeg,
10.8 Mbyte)
Case 3: Strong
(100 Pa s) layer
Free slip
Total model time: 10 000 (s)
Char wavelength = 1.1 (m)
To play the movie, click here
(mpeg, 6.6 Mbyte)
No slip
Total model time: 30 000 (s)
Char wavelength = 0.3 (m)
To play the movie, click here (
mpeg, 4.4 Mbyte)
Back to Harro Schmeling's homepage
H. Schmeling, Last modified May 29, 2003