
What follows is an abstract and a few figures of a recent paper of me (Schmeling, 1998 see publication list):
Various causes for mantle melting (decompression, heating
or release of water) combined with current estimates of upper mantle temperatures
and the state of stress in the lithosphere suggest that in many regions
the asthenosphere might be partially molten, but melts may not always be
able to rise to the surface. The governing equations describing melting,
melt segregation, compaction and depletion in a deforming medium
are discussed with emphasis on the physical processes involved. To combine
these processes with a convecting upper mantle flow, a "Compaction Boussinesq
Approximation" (CBA) is introduced and tested with known solutions. Driving
forces include thermal, melt, depletion and enrichment buoyancy. The bulk
viscosity and its dependence on porosity has a significant effect on the
melt flow even for distances large compared to the compaction length. 1D
and 2D solitary porosity waves are discussed with particular emphasis on
a variable bulk viscosity, compaction, and dilatation of the matrix.
Melting, segregation and solidification processes are studied in a self-consistent
model of a variable viscosity plume head arriving at the base of the lithosphere.
It is shown that melt buoyancy dominates segregation velocities. However,
a variable bulk viscosity may still have some influence on the segregation
velocities, while dynamic pressures may be neglected. In the absence of
a mantle plume a partially molten undepleted asthenosphere may develop
melting instabilites, driven by thermal, melt and depletion buoyancy. This
instability propagates laterally with velocities of the order of
several cm/a and has a length scale of about 1.8 times the thickness of
the partially molten asthenosphere. Volcanism associated with this propagating
instability might have a similar appearance as hot spot tracks.
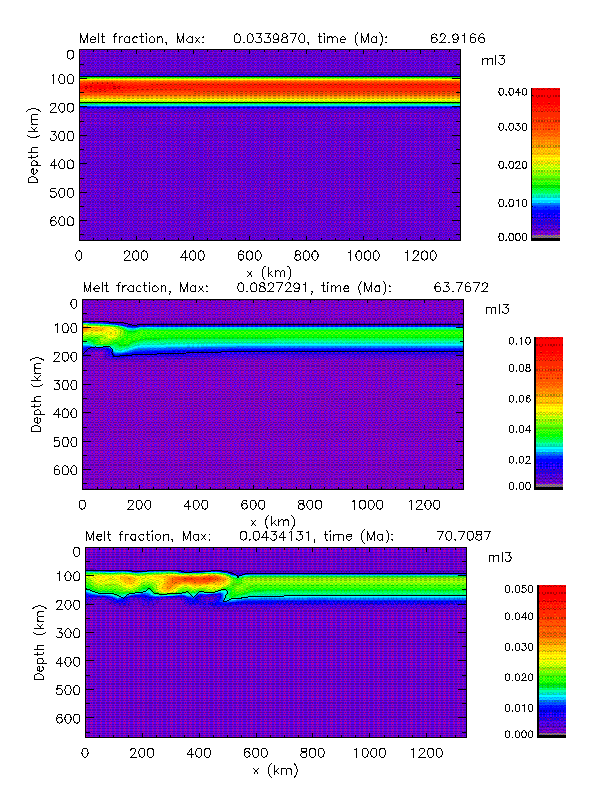
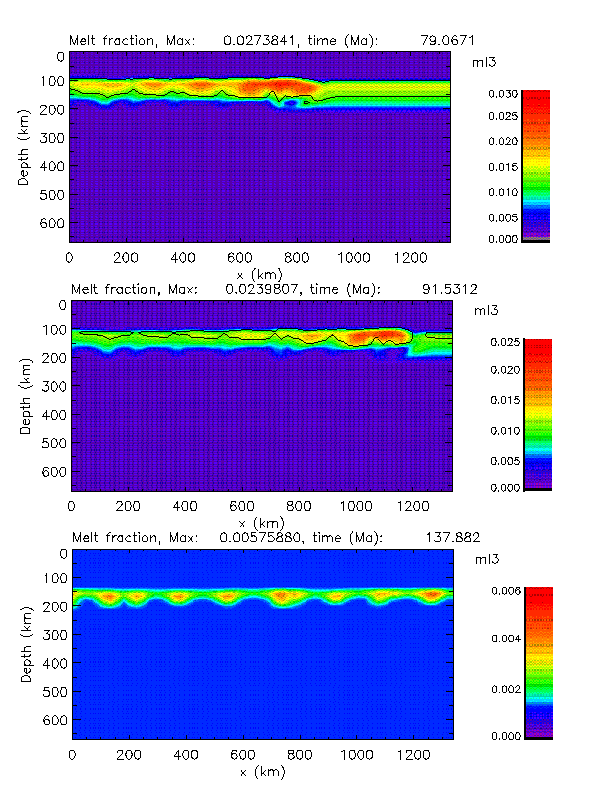
Some figures showing the propagating melt instability:


Fig. 10 a and b. Snap shots at different times of a propagating melting instability in the asthenosphere due to thermal, melt, and depletion buoyancy. An initial temperature distribution was assumed as follows: a conductive profile through the lithosphere was taken with a surface heat flow of 80 mW/m2 followed by an adiabatic gradient below which is pinned to 1600 °C at a depth of 413 km (this corresponds to the upper bound of the olivine-spinel transition thermometer, c.f. chapter 2.2). A water-undersaturated solidus is assumed as shown in Fig. 1c. A non-Newtonian, temperature and pressure dependent rheology is assumed based on laboratory data. A dry rheology is assumed for the solid mantle and a wet rheoloy for the partially molten regions (see Schmeling and Bussod, 1996, for the choice and discussion of the rheological parameters). Assuming an activation volume of 10 10-6 m3/Mole the depth-dependence of the viscosity is only weak. The starting time of this run, 62.9 Ma, is arbitrary. Only the buoyancy term is considered in the momentum equation for the melt, compaction and dynamic pressure are neglected. Other important parameters are: thermal diffusivity = 10-6 m2/s, density = 3400 kg/m3, thermal expansivity = 3.7 10-5 K-1, density difference matrix - melt = 200 kg/m3, depletion density = 3150 kg/m3, latent heat = 400 kJ/kg.

Fig. 11. a) Propagating melt instability within the asthenosphere
as visualized by log10 of the vertically integrated melt production
rate as a function of horizontal distance x and time. The logarithm is
taken just for better visualization. The values of the contour lines shown
are 3.8, 4.6, 5.4. To get the integrated production rate in units
of (%km/Ma), 2.153 has to be subtracted before applying 10x. b) Vertically
integrated melt production rate as in a), but for a later stage. This stage
is dominated by the arrival of plumes at the times 143, 145.6 and 147.2
Ma.
Some figures showing meltind and segregation in a plume
head:

Fig. 6 Snap shot of the temperature (a), melt generation
(b) and melt fraction (c) of a variable viscosity plume head arriving at
the base of the lithosphere. The background temperature is adiabatic with
a potential temperatue Tp = 1400°C. The shear viscosity is temperature-dependent
according to an Arrhenius law which is pinned at a viscosity of 10e20
Pa s for the adiabatic background temperature and at 10e18 Pa s for
the excess temperature of 300 °C. The bulk viscosity depends on the
melt fraction according to Fig. 2 (ellipsoids with 0.1 aspect ratio).
A solidus temperature according to water-undersaturated peridotite is assumed
(Fig. 1c). Other parameters are: Reference density = 3500 kg/m3, depletion density =
3202 kg/m3, enrichment density = 3598 kg/m3, density difference matrix - melt = 125 kg/m3, g = 10
m/s2, h = 200 km, thermal diffusivity = 10e-6 m2/s, thermal expansivity = 2.4 10e-5
K-1, a = 10e-3 m3, b = 1000, n = 3, melt viscosity = 10 Pa s, heat capacity = 1300 J/(K kg),
Latent heat = 400 kJ/kg. The mechanical boundary conditions include no slip
at the top (= base of the lithosphere) and free slip at the other boundaries.
Thermal boundary conditions are constant temperature at the top and bottom
and zero heat flux at the sides. The computational area is 200 x
200 km, the resolution is 121x121 grid points.

Fig. 7 Basaltic enrichment (a) and depletion (b) of the
plume head, shown in Fig. 6.

Fig. 8 Vertical (a) and horizontal (b) segregations
velocities of the melt in the plume head shown in Fig. 6.

Fig. 9 Various contributions to the total vertical segregation
velocity, shown in Fig. 8a. a) contribution from buoyancy term, b) contribution
from compaction term, c) contribution from dynamic pressure.
More figures, showing melting temperatures, bulk viscosities and 1D and 2D porosity waves:
Fig. 1. Illustration of mantle melting due to decompression (a), heating (b) and release of water (c). Solidus temperature for peridotite (thick curve in a), b) and c)) is taken from Takahashi (1986). Thin curves give typical geotherms with a potential temperature Tp =1400 °C. In a) upwelling and decompression may be due to 50% thinning of the lithosphere. In b) the mantle temperature is increased by 200°C by e.g. the arrival of a plume. In c) the solidus is decreased due to 2.9 wt% water (Inoue and Sawamoto, 1992). The thin dashed curve give the saturated wet solidus temperature.
Fig. 2. Non-dimensional bulk viscosity of a material containing melt in spherical, ellipsoidal or tubular inclusions as a function of melt fraction. The scaling viscosity is the shear viscosity of the matrix.
Fig. 3 Rise of a 1D porosity wave with variable bulk viscosity. The background porosity is 2%, the initial amplitude of the cosine shaped anomaly was 10%. Rm = 1000, Rtn = 1, no melting and freezing is assumed. All quantities are non-dimensional according to the scaling laws given in equ. (19). a) Porosity at initial time and t´= 0.06, b) Divergence of the matrix at t´ = 0.06, c) Segregation velocity and its contributions due to buoyancy and compaction-dilatation of the matrix at t´ = 0.06.
Fig. 4. Rise of a 2D cylindrical porosity wave with constant bulk viscosity b´ = 1. The background viscosity is 2%, the maximum porosity is 6%. Rm = 10, Rtn = 0.0288, no melting and freezing is assumed. All quantities are non-dimensional. The non-dimensional compaction length based on the background porosity is 0.01667. a) melt fraction, b) divergence of the matrix velocity, c) vertical segregation velocity, d) horizontal segregation velocity, e) buoyancy contribution of the vertical segregation velocity, f) compaction contribution to the vertical segregation velocity.
Fig. 5 Non-dimensional phase velocity of solitary magma waves in 1D and 2D. The analytical solutions are taken from Barcilon and Lovera (1989). The symbols give numerical results which assumed the CBA. The scaling of the phase velocity is according to Barcilon and Lovera (1989), to transform to the scaling law used here, the velocities have to be multiplied with 0n-1 Rm/Rtn. The porosity amplitude is defined as may/ 0, where 0 is the background porosity.
Last modified on: October, 14, 1998