Partial Melting of Mafics Rocks from
Electrical Impedance Spectroscopy Measurements
Jerome MAUMUS 1 (maumus@geophysik.uni-frankfurt.de),
Nikolai BAGDASSAROV 1,
Harro SCHMELING 1,
and Benoit ILDEFONSE 2
(1) Institut für Meteorologie und Geophysik,
Johann Wolfgang Goethe-Universität, 60323 Frankfurt am Main, Deutschland
(2) Laboratoire de Tectonophysique, Universite Montpellier II, France
Abstract
Presence of melt phase with a specific topology may have a large effect on the
internal friction and electrical conductivity of rocks. The variations
of electrical properties at high temperature have been studied by measuring
electrical resistance as a function of frequency, temperature and time
in synthetic upper-mantle rocks (olivine crystals and basalt glass) and
a natural gabbro from Oman. Gabbro samples show a uniform grain size of
250-300 µm and the absence of cracks and alteration in the starting
material. The rock consists of 50-55 vol% Plg, 35% Cpx and 15% Opx. The
synthetic upper-mantle rock sample is an aggregate of San Carlos olivine
with a grain size of 10-25 µm and 5% of synthetic basalt glass.
The electrical impedance measurements have been carried out in a piston
cylinder apparatus at 3, 5 and 10 kbar and temperature up to 1200°C.
For each temperature, the electrical impedance has been estimated in a
frequency range from 10-2 to 105 Hz. The bulk electrical resistance of
samples has been estimated from Argand plots (Imaginary vs. real componant
of complex impedance). The control of the equilibrium was provided by a
monitoring of the electrical impedance as a function of time. At subsolidus
temperature, the electrical conductivity of gabbro follows an Arrhenian
temperature dependance with the activation energy 1.15 eV. At temperature
close to the liquidus (ca. 1215°C at 10
kbar, 1175°C at 5 kbar for gabbro and 1240°C
at 10 kbar for olivine), the conductivity increases drastically with time
reaching a steady-state value in a few days. This relaxation effect is
perhaps due to a slow developing of a better melt interconnection or caused
by a chemical reaction between crystals and melt. In a partially molten
state with about 15% of melt, gabbro samples are characterised by the electrical
conductivity ca. 0.3-0.4 S/m. This value corresponds to the observed electrical
conductivity in the lower part of AMC (Sinha et al. 1997). The estimated
temperature in this part of AMC may be about 1175-1185°C:
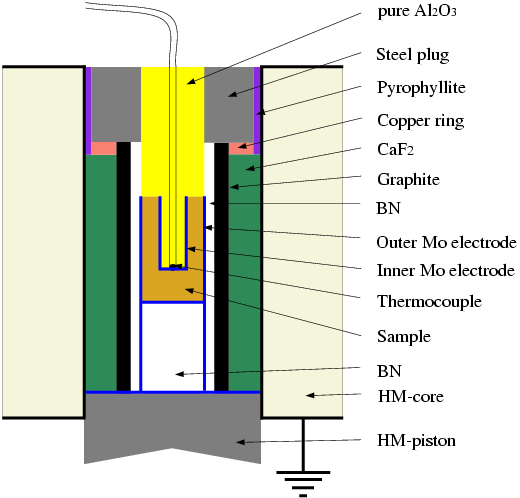
Piston-Cylinder Experiments
Experiments were carried out in a piston-cylinder apparatus with a coaxial
cylindrical cell Figure 1 to measure electrical
impedance (Khitarov et al., 1970). The measuring cell is situated inside
a boron nitride sleeve, graphite heater and a pressure transmitting medium
made of CaF2. Boron nitride sleeve insulates the measuring cell
from a graphite contamination. The starting sample is a fine powder, pressed
between 2 coaxial cylindrical electrodes made from molybdenum foil in order
to prevent iron losses from a sample. Inside the inner electrode, we placed
a Pt30%Rh-Pt6%Rh thermocouple. For electrical measurements, RC-bridge
(Solartron 1260) was connected to the inner electrode by a thermocouple
wire and to the outer electrode by the lower piston. Before each measurement,
the RC-parameters of the cell were calibrated for open and closed circuite.
The geometric factor of the cell Gf was calibrated by measuring
the resistance of NaCl-water solutions placed between coaxial electrodes
at room temperature and pressure.
Figure 1: Cell Design
Impedance Spectroscopy Measurements
A voltage v(t) = Vm ·sin( wt)
at a frequency n = w/2pi
is applied to the cell and the resulting current i(t) = Vm ·sin(
wt
+ q) is measured. From the phase shift, we can
define the electrical impedance Z(w) = v(t)/i(t)
characterised by a magnitude |Z(w)|
and a phase angle q(w).
The complex impedance Z is calculated from |Z(w)|
and q(w). Impedance
is a concept more general than resistance because it take the phase shift
into account. Complex impedance Z is a complex number composed by an ohmic
resistance (real component Re(Z)) and a reactance (imaginary component
Im(Z)): Z = Re(Z) + j ·Im(Z) with j2 = -1.
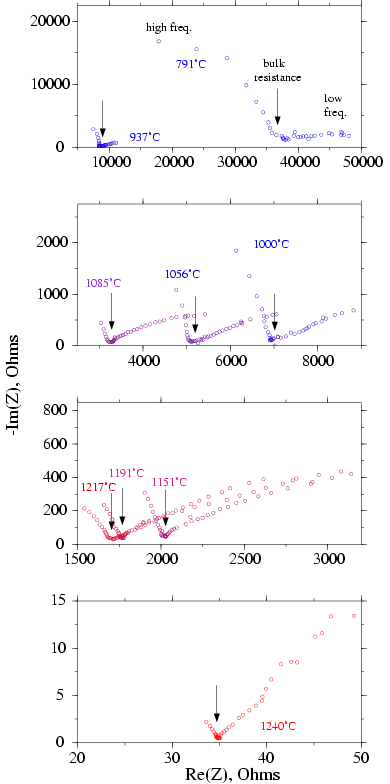
Impedance spectroscopy Figure 2 consists
in measuring Re(Z) and Im(Z) in a large range of frequency (10-2
to 105 Hz). As an exemple are plotted some measurement results
at different temperatures for a gabbro sample at 10 kbar. The data are
represented in Argand diagrams (Im(Z) vs. Re(Z)). At each temperature,
data curves show two parts of circles. The left part related to high frequency
mesurements describes the sample bulk electrical properties. The second
part is related to grain boundary or electrode electrical properties or
so-called low frequency dispersion. The data can be fitted to an electrical
equivalent circuit model (see Mac Donald, 1987; Roberts and Tyburczy, 1991)
to determine the sample bulk resistance R (in W)
and to calculate the sample bulk resistivity r
(in W.m): r = R ·Gf
where Gf is the geometric factor. In first approximation, R
is given by the intersection between the Im(Z) curve and the Re(Z) axis.
The bulk conductivity s is given by s
= 1/r.
Figure 2: Impedance Spectroscopy measurements of a Gabbro Sample at 10
kbar
Frequency range between to 105 and 10-2
Hz
Two different samples
In order to investigate electrical conductivity of regions where partial
melting occurs, we examined 2 samples. The first sample is a natural gabbro
rock representating the lower oceanic crust (where magma chamber are located
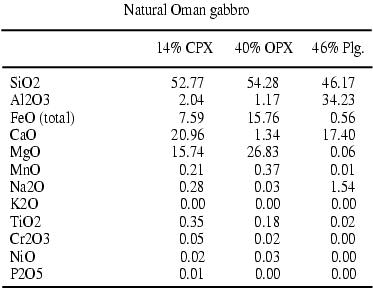
above mid-oceanic ridges). This gabbronorite Table1
from Oman ophiolites is composed of 46%vol. plagioclase feldspar, orthopyroxene
(40%vol.) and clinopyroxene (14%vol.). This cumulate rock is caracterised
by a homogeneous grain size (ca. 350 mm). The
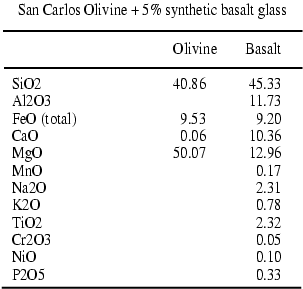
second sample is an aggregate of San Carlos Olivine and 5%weight of a synthetic
basalt glass Table2 . Olivine grain size is between
10 and 25 m. We have chosen a basalt glass composition that is in equilibrium
with olivine at a temperature range between 1200 and 1300°C
and for pressures about 10-20 kbar (Ulmer, 1989).
Tables 1-2: Composition of starting material in oxides weight percent
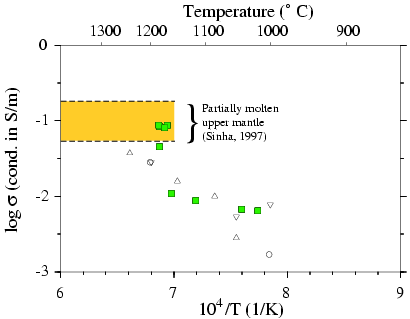
Results: Olivine+Basalt samples
Figure 3 Green squares show our conductivity
measurements (Olivine Fo90+5% basalt). Only one experiment was made on
olivine at a pressure of 10 kbar and a temperature about 800 to 1200°.
At each temperature we estimated the bulk conductivity of the sample as
a function of time. The sample reached a stable value after about 2 or
three days. At low temperature, data can be fitted to an Arhennius law
s
= s0 ·expAe
/ kT where s (in S/m) is the electrical
conductivity, s0 a constant, Ae
the activation energy, k the Boltzman constant and T the temperature (in
K). For temperature lower than 1200°
our sample show the electrical behaviour of a dry polycristalline olivine.
However, our measurements show an about 1 order of magnitude higher conductivity
than previous works (e. g. Xu, 2000) and our activation energy is lower
than what is usually founded for polycristalline sample (1.1 eV vs. 1.4
eV). The difference in conductivity values should be explain by the high
dependence of olivine conductivity to the oxygen fugacity conditions. Presence
of molybdenum foil and boron nitride may create low oxygen fugacity conditions
for temperature between 1000°C
and 1200°C. At temperature close
to the liquidus, the conductivity increases dramatically (one order of
magnitude). At 1200°C, it take
3 days to reach a stable state of conductivity. These may be related to
a partial melting occuring in the sample and to a better interconnection
of basaltic melt as a function of time. When partial-melting begins, we
reach a conductivity of 0.1 S/m.
Circles and triangles show measurements of Roberts and Tyburczy (1999)
at atmospheric pressure on an aggregate of olivine (Fo80) and 5% basalt.
They prepared their sample at HT-HP conditions and made the electrical
measurements in a gaz mixing furnace at 1 atm with a controlled oxygen
fugacity. It is difficult to compare their results with our data because
olivine and basalt don't have the same composition. Our basalt contains
more iron and must be more conductive. The difference in conductivity is
about 0.5 order of magnitude for our sample.
The yellow rectangle indicate the range of electrical conductivity
from magnetotelluric measurements in the upper mantle above Mid-Atlantic
ridge axis where partial melting presumably occurs (Heinson et al., 2000).
Our measurements have a good agreement with these data.
Figure3: Electrical conductivity of Olivine+basalt samples
Log of bulk electrical conductivity vs. reciprocal temperature.
Green squares: this study, triangles and circles: Roberts and Tyburczy
Results: Gabbro samples
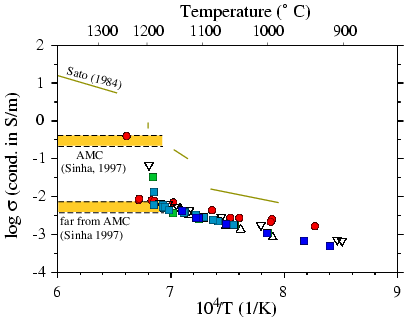
For Oman Gabrro Figure 4, we provided experiments
at 10 (circles), 5 (squares) and 3 kbar (triangles). Gabbro samples show
a behaviour similar to the olivine-basalt aggregates. At temperature above
the liquidus samples follow the behaviour of a dry polycristalline rock.
Data can be fitted to an Arhennius law. We don't observe a strong influence
of the pressure on the conductivity. At temperature close to the liquidus,
the conductivity increases drastically (0.5 to 1.5 order of magnitude).
This could be explained by partial melting of the sample and to a better
interconnection of the melt as function of time. At 10 kbar and 1240°C,
we reached a conductivity (s) of 0.4 S/m. at
5 kbar and 1180°C, s=
0.03 S/m, at 3kbar and 1170°C
s=
0.05 S/m.
Microprobing of the sample after quenching shows the presence of a
large amount of melt (15 to 30%). Theses observations may indicate that
we are not able to detect the beginning of the melting process. From a
jump of the electrical conductivity we may only detect a stage of a developed
melt inteconnection. The large amount of pyroxene in the sample may not
allowed any interconnection of melt for low melt fraction (see e.g. Laporte
and Provost (2000)).
The green lines show measurements of Sato and Ida (1984) at atmospheric
pressure. The presence of olivine in his gabbro results in a higher conductivity.
However, the difference of conductivity is not too large (0.5 order of
magnitude).
The lower yellow rectangle shows the range of conductivity from electromagnetic
measurements in gabbro far from the axial magma chamber (AMC) at mid-oceanic
ridge axis (Sinha et al., 1997). These data are in a good agrement with
our measurements of gabbro without interconnected melt. The upper yellow
rectangle shows the range of conductivity of gabbro in axial magma chamber
at ridge axis (Sinha et al., 1997). Only the measurement made at 10 kbar
shows a conductivity value in good agreement with the electromagnetic data.
Figure4: Electrical conductivity of Gabbro samples
Log of bulk electrical conductivity vs. reciprocal temperature.
This study: Disk 10kbar, Squares 5 kbar, Triangles 3 kbar
Literature
Heinson, G., S. Constable, A. White, Episodic melt transport at mid-oceanic
ridges inferred from magnetotelluric sounding, Geophys. Res. Lett., 27
(2000) 2321-2324.
Khitarov, N.I., A. B. Slutsky, and V.A. Pugin, Electrical conductivity
of basalts at high T-P and phase transitions under upper mantle conditions,
Phys. Earth Planet. Interiors, 3 (1970) 334-342.
Laporte, D., and A. Provost, The grain scale distribution of silicate
carbonate and metallosulfide partial melts: a review of theory and experiments,
in: Physics and chemistry of partially molten rocks, edited by N. Bagdassarov,
D. Laporte and A.B. Thompson, Kluwer (2000) pp 93-140.
Roberts, J., and J. Tyburczy, Partial-melt electrical conductivity:
Influence of melt composition, J. Geophys. Res., 104 (1999) 7055-7065.
Sato, H., and Y. Ida, Low frequency electrical impedance of partially
molten gabbro: The effectof melt geometry on electrical properties, Tectonophysics,
107 (1984) 105-134.
Sinha, M.C., D.A. Navin, L. M. MacGregor, S. Constable, C. Pierce, A.
White, G. Heinson, and M.A. Inglis, Evidence for accumulated melt beneath
the slow-spreading mid-Atlantic ridge, Phil. Trans. Roy. Soc. Lond. A,
355 (1997) 168-172.
Ulmer, P., The dependence of the Fe2+-Mg cation-partioning
between olivine and basaltic liquid on pressure, temperature and composition,
Contrib. Mineral. Petrol., 101 (1989) 261-273.
Xu, Y., T.J. Shankland, A.G. Duba, Pressure effect on electrical conductivity
of mantle olivine, Phys. Earth Planet. Interiors, 118 (2000) 149-161.
Jerome Maumus
6 Apr 2001, 20:10.